What are User Engagement Metrics (And Which Should You Track)?
By SCUBA Insights
Think of the customer journey as a story that describes your users: how they behave while they are on your website or app, and what you can do to improve their experience so they return.
Detailing the customer journey requires analysis of your existing data so you can map out various behavioral scenarios and understand your users. For example:
- Shelly hears about a must-have prom dress
- She searches Google for the brand selling that dress
- She clicks the website but can’t find the dress she heard about and leaves the site
- Then, she sees a retargeting ad for the dress on the brand's Facebook page
- She clicks on the link in the bio to add the dress to her shopping cart
- Shelly abandons the cart
By mapping the customer journey you can start to see patterns that help you understand why Shelly left your site the first time, the effectiveness of retargeting, and why she later abandoned her cart.
The benefits of customer journey mapping
Mapping prospects across multiple touchpoints allows organizations to understand user engagement, across various stages of their buying journey, and provides both qualitative and quantitative data to help you benchmark the customer experience, optimize your process, and improve your conversion rate.
Mapping the customer journey can help you understand:
- Actions: What actions are customers performing at every stage, and what are they doing to progress from one point to another?
- Motivations: What keeps the customer so motivated to move on from one stage to another? What are their feelings behind it, and what makes them care?
- Questions: What are the issues, unpredictability, or jargon that keep them from getting to the next stage?
- Obstacles: What kind of obstacles, including cost, implementation, process, or structure, prevent the customer from moving to the next stage?
Visualizing customer journey touchpoints
Customer journey mapping requires an omnichannel approach in order to give a fully comprehensive visual story of the interaction between your brand and your customers. Your customer journey map should show how customers interact with you via social media, email, your app or website, live chat, paid ads, and more.
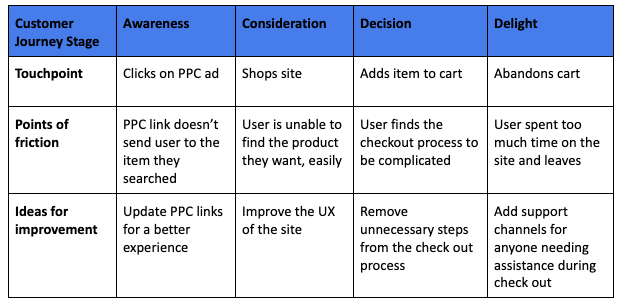
A simple visualization for the customer journey might look like this:

At each touchpoint, you can start to see patterns about how customers find you, what types of friction a customer experiences at that touchpoint, and identify processes that can be implemented to push customers through the journey. In doing so, your brand can improve not only your KPI user metrics but your customer experience as well.
Looking to visualize your customer journey for an improved customer experience?
Learn how Scuba can give you 360-degree visibility into your customer journey--through a single pane of glass. Request a demo today.
Blog Categories
Recent Blog Posts
- Crack the Code: How To Maximize Ad Revenue in a Privacy-First World
- MTCDPA: Will Montana’s New Privacy Measure Disrupt the Future of Advertising, and Business?
- Capture Signal Loss with Decision Intelligence
- AWNY24 Session Recap: Privacy Hijacks Signals: Future-Proof 1P Data with Real-Time Data Collaboration
- #PROGIONY: Game-Changers, Fading Fads, and the Future of Advertising
- Publishers’ Responsibilities in the Age of Signal Loss
Popular Blog Posts
- Diving Deeper into Analytics: How SCUBA Fills the Gaps Left by GA4
- 48 Analytics Quotes from the Experts
- 10 Great Examples of Hyper-Personalization in Entertainment & Media
- Data Bias: Why It Matters, and How to Avoid It
- It's Time to Stop Being “Data-Driven” (And Start Being Data-Informed)
- 27 Amazing Tech and Product Blogs: Theory, Tactics, Frameworks
